Nuxt.js ライブラリ「vue-ganttastic」をインストールしてガントチャートを実装する
ライブラリ「vue-ganttastic」をインストールすると、ガントチャートの実装が簡単に可能です。ここでは、nuxt.jsでvue-ganttasticを利用するための手順と簡単な使い方を記述してます。
環境
- OS CentOS Linux release 8.0.1905 (Core)
- node V12.16.3
- npm 6.14.4
- nuxt 2.12.2
Nuxt.js環境構築
下記のコマンドで構築。ここでは、nuxtappという名前でプロジェクトを作成してます。
npx create-nuxt-app nuxtappここでは、下記の設定で構築してます。
create-nuxt-app v2.15.0
✨  Generating Nuxt.js project in testnuxt
? Project name nuxtapp
? Project description My doozie Nuxt.js project
? Author name
? Choose programming language JavaScript
? Choose the package manager Yarn
? Choose UI framework None
? Choose custom server framework None (Recommended)
? Choose Nuxt.js modules (Press <space> to select, <a> to toggle all, <i> to invert selection)
? Choose linting tools ESLint
? Choose test framework None
? Choose rendering mode Universal (SSR)
? Choose development tools (Press <space> to select, <a> to toggle all, <i> to invert selection)
yarn run v1.22.4※yarnをインスールしているので、ここではnpmではなくyarnを選択してます。
## yarnのインスールは下記コマンド
npm install -g yarn
外部IP許可
localhostではなくプライベートIPを利用して接続して確認したいので、作成したプロジェクトnuxtappの配下にあるpackage.jsonに下記を追加します。
"config": {
  "nuxt": {
    "host": "0.0.0.0",
    "port": "3000"
  }
},
vue-ganttasticインストール
下記のコマンドでインストールします。
## 作成したプロジェクトに移動
cd nuxtapp

## インストール
yarn add vue-ganttastic moment
vue-ganttastic使い方
plugins配下にplugin.jsを作成し、下記の通りに編集します。
import Vue from 'vue'
import {GGanttChart, GGanttRow} from 'vue-ganttastic'
Vue.component('g-gantt-chart',GGanttChart)
Vue.component('g-gantt-row',GGanttRow)
プロジェクト配下にあるnuxt.config.jsに下記のコードを追加します。
plugins: [
    {
      src: '@/plugins/plugin',
      mode: 'client'
    }
  ],
pages配下にあるindex.vueを下記の通りに編集します。
<template>
<div class="container">
<g-gantt-chart
:chart-start="myChartStart"
:chart-end="myChartEnd"
>
<g-gantt-row
v-for="row in rows"
:key="row.label"
:label="row.label"
:bars="row.bars"
bar-start="myStart"
bar-end="myEnd"
/>
</g-gantt-chart>
</div>
</template>
<script>
export default {
components: {
},
data() {
return {
myChartStart: "2020-03-01 00:00",
myChartEnd: "2020-03-03 00:00",
rows: [
{
label: "My row #1",
bars: [
{
myStart: "2020-03-01 12:10",
myEnd: "2020-03-01 16:35"
}
]
},
{
label: "My row #2",
bars: [
{
myStart: "2020-03-02 01:00",
myEnd: "2020-03-02 12:00"
},
{
myStart: "2020-03-02 13:00",
myEnd: "2020-03-02 22:00"
}
]
}
]
}
}
}
</script>
<style>
.container {
margin: 0 auto;
min-height: 100vh;
display: flex;
justify-content: center;
align-items: center;
text-align: center;
font-size: 15px;
}
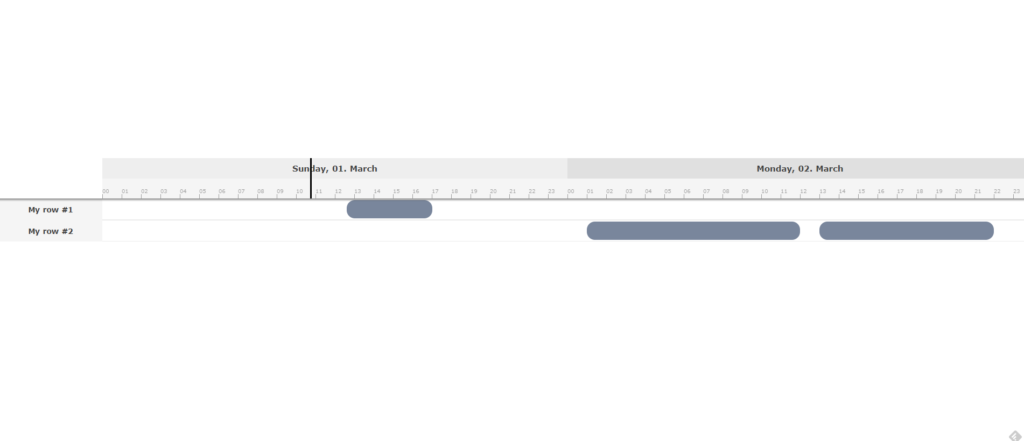
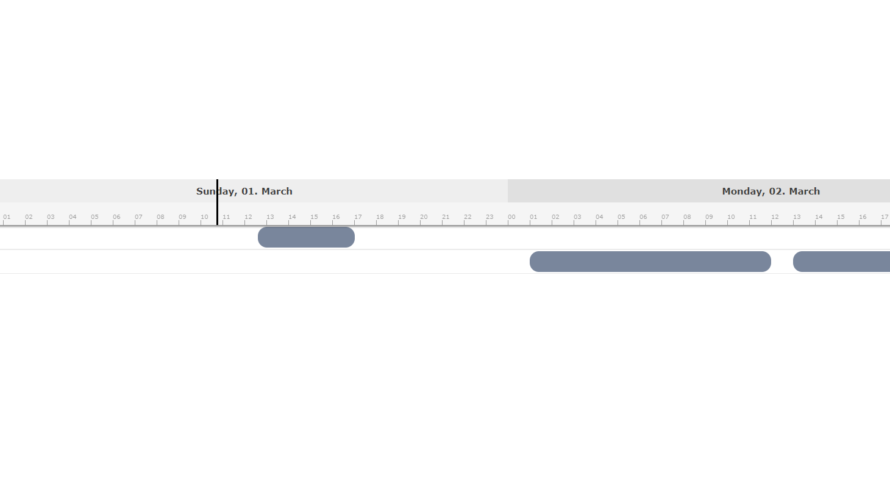
</style>起動します
yarn devブラウザから http://プライベートIP:3000にアクセスすると、ガントチャートが実装されていることが確認できます。