React.js ライブラリ「react-plotly」を使って動かせるグラフを作成する

ライブラリ「react-plotly」をインストールすると、動かせるグラフを作成することが可能です。ここでは、react.jsでreact-plotlyを利用するための手順と簡単な使い方を記述してます。
環境
- OS CentOS Stream release 8
- node V12.16.3
- npm 6.14.7
- React 16.13.0
react.js環境構築
下記のコマンドで構築してます。ここでは、react-appという名前でプロジェクトを作成してます。
create-react-app react-appreact-plotlyインストール
作成したプロジェクトに移動して、インストールします。
## 作成したプロジェクトに移動
cd react-app

## インストール
npm install react-plotly.js plotly.js
react-plotly使い方
srcディレクトリにsample.jsと名前で下記のコードを記述します。
import React from "react";
import Plot from 'react-plotly.js';

const Sample = () => {

    return (
        <div>
            <Plot
                data={[
                    {
                        x: [1, 2, 3],
                        y: [2, 6, 3],
                        type: 'scatter',
                        mode: 'lines+markers',
                        marker: { color: 'red' },
                    },
                    { type: 'bar', x: [1, 2, 3], y: [2, 5, 3] },
                ]}
                layout={{ width: 500, height: 500, title: 'A Fancy Plot' }}
            />
        </div>
    );
};

export default Sample;
次に、srcディレクトリ配下にあるApp.jsを下記のように編集します。
import React from 'react';
import Sample from './sample';
import './App.css';

function App() {
  const style = {
    width: "50%",
    margin: "0 auto",
    marginTop: 150,
  };
  return (
    <div className="App">
      <div style={style}>
        <Sample />
      </div>
    </div>
  );
}

export default App;
実行します。
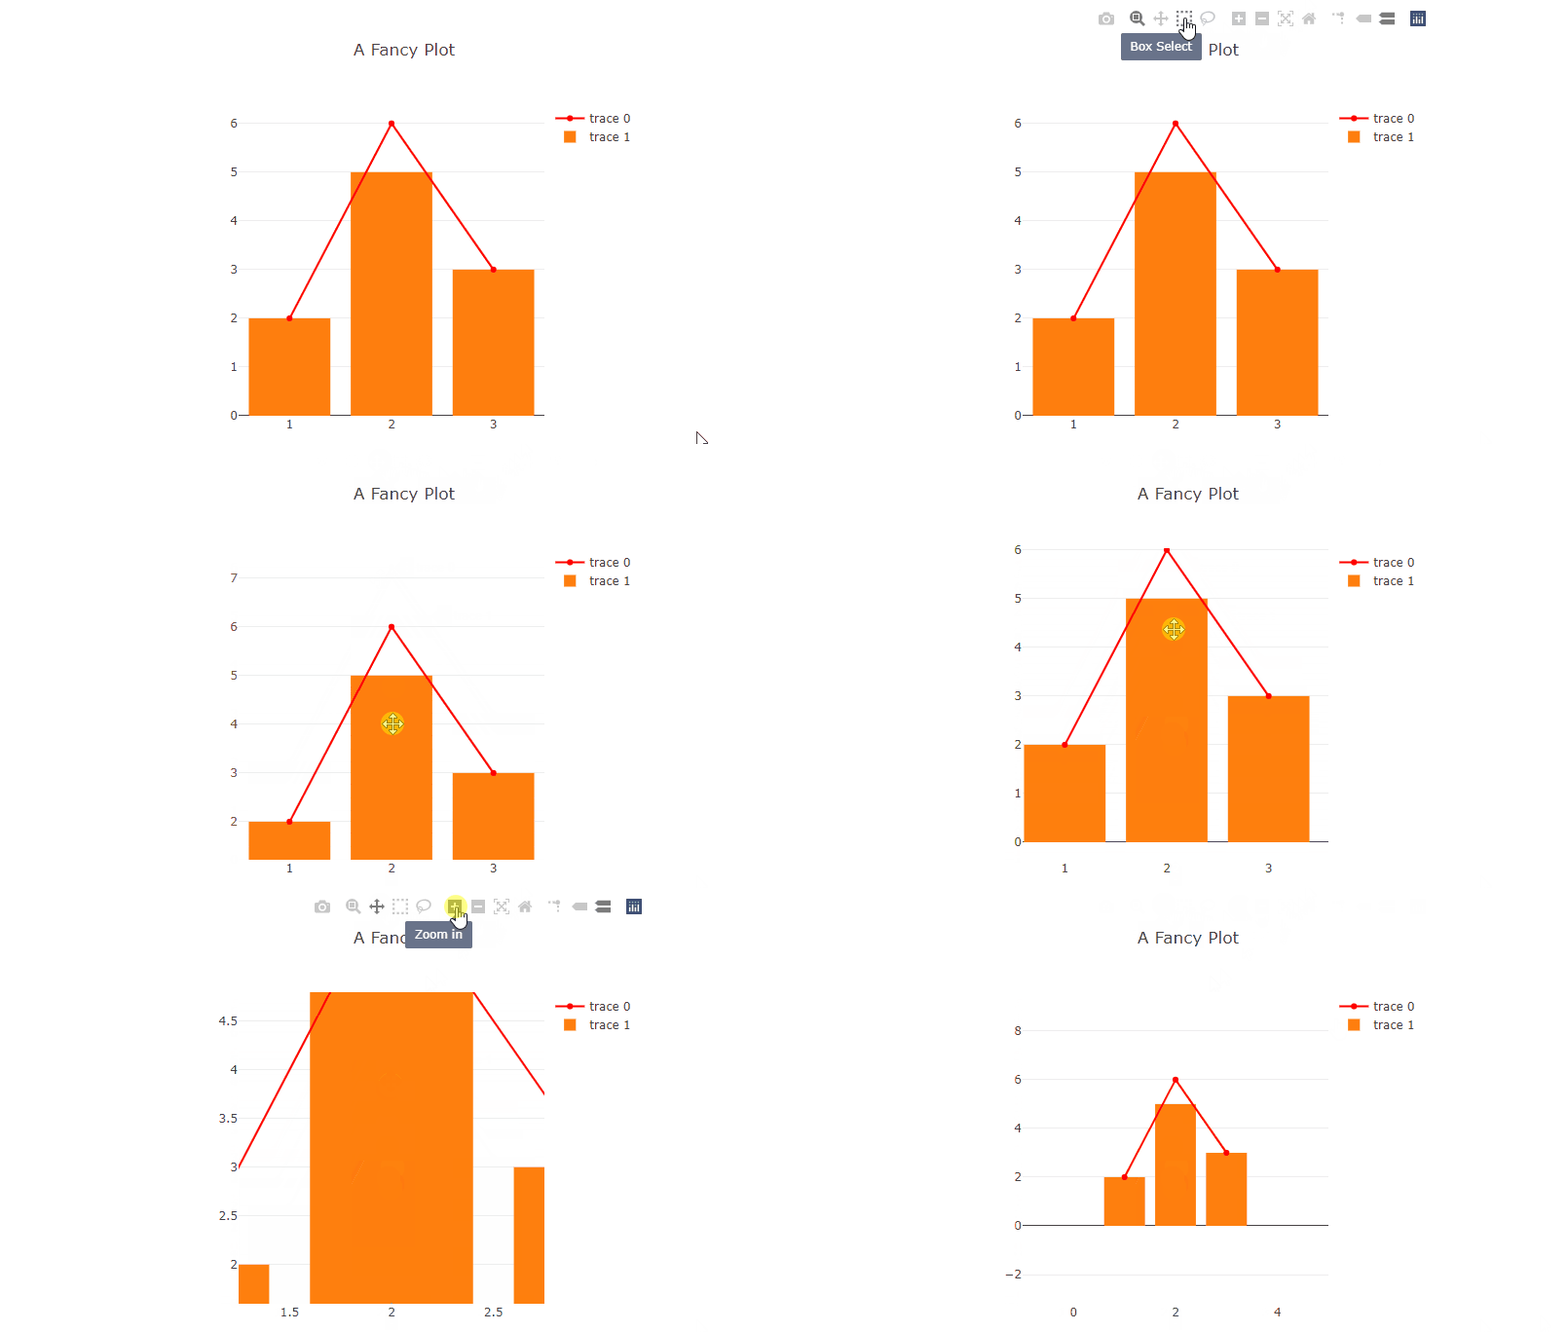
npm startブラウザから http://プライベートIP:3000にアクセスすると、動かせるグラフが作成されていることが確認できます。

-
前の記事

C# 指定した区切り文字で文字列を分割する 2021.02.15
-
次の記事

javascript 重複しないランダムな配列を作成する 2021.02.16


コメントを書く