Windows Server2012 WinlogbeatをインストールしてイベントログをElasticsearch+Kibanaで可視化する
- 作成日 2020.06.20
- 更新日 2020.07.17
- elasticsearch kibana windows server Winlogbeat
- elasticsearch, windows server, Winlogbeat
Windows Server2012にWinlogbeatをインストールしてイベントログをlasticsearch+Kibanaで可視化するまでの手順を記述してます。
環境
- OS Windows Server 2012 R2
- Elasticsearch 7.7.0
- kibana 7.7.0
※windows10にElasticsearchをインストールする手順はこちら
※windows10にkibanaをインストールする手順はこちら
Winlogbeatダウンロード
こちらのサイトからダウンロードします。
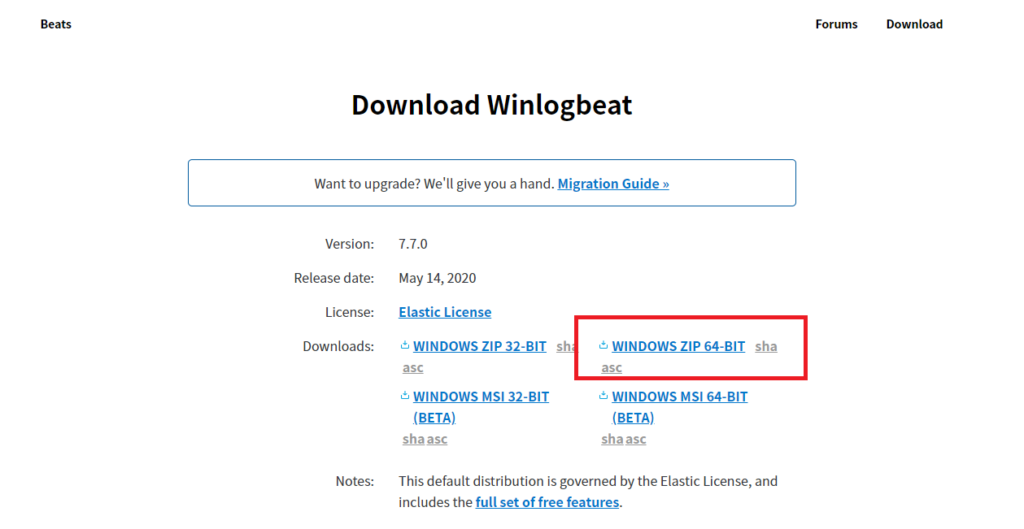
「winlogbeat-7.7.0-windows-x86_64.zip」がダウンロードされます。
Winlogbeat起動
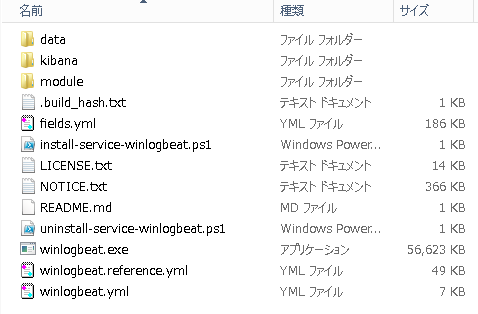
ダウンロードした「 winlogbeat-7.7.0-windows-x86_64.zip 」を解凍します。
自分の場合は「winlogbeat」にリネームしてC直下に移動させてます。
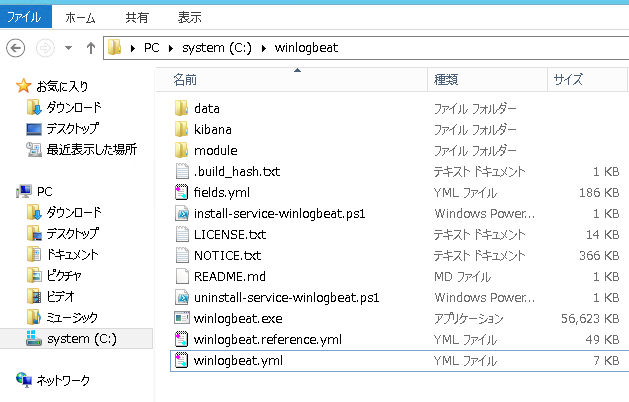
解凍したフォルダの中にある「winlogbeat.yml」を編集します。
windowsのシステムログは、非常に大きいので、ここでは「Securityログ」だけを収集します。「winlogbeat.event_logs:」の部分を下記の通りにコメントアウトします。
winlogbeat.event_logs:
  #- name: Application
  #  ignore_older: 72h

  #- name: System

  - name: Security
    processors:
      - script:
          lang: javascript
          id: security
          file: ${path.home}/module/security/config/winlogbeat-security.js

  #- name: Microsoft-Windows-Sysmon/Operational
  #  processors:
  #    - script:
  #        lang: javascript
  #        id: sysmon
  #       file: ${path.home}/module/sysmon/config/winlogbeat-sysmon.js
「output.elasticsearch:」の部分に「Elasticsearch」 が動いているサーバーのIPを指定します。
#-------------------------- Elasticsearch output ------------------------------
output.elasticsearch:
  # Array of hosts to connect to.
  hosts: ["192.168.xxx.xxx:9200"]
管理者としてPowerShell実行して「Winlogbeat」があるフォルダに移動します。
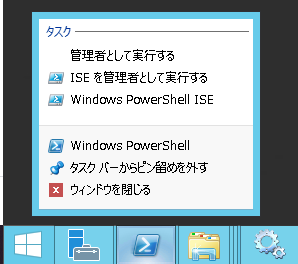
cd C:\winlogbeat起動します。オプション-eはデバックモードとなります。
.\winlogbeat.exe -c winlogbeat.yml -e「EventLog[Security] successfully published 50 event」が表示されていれば成功です。
INFO    beater/eventlogger.go:86
EventLog[Security] successfully published 50 event
「Ctrl + C」で停止できます。
Winlogbeatサービス登録
サービスに登録しておきます。winlogbeatがあるフォルダに移動して下記のコマンドを実行します。
※自分の場合は「C:\winlogbeat」にあります。
cd C:\winlogbeat
.\install-service-winlogbeat.ps1

<出力結果>
Status      : Stopped
Name        : winlogbeat
DisplayName : winlogbeat
起動します。
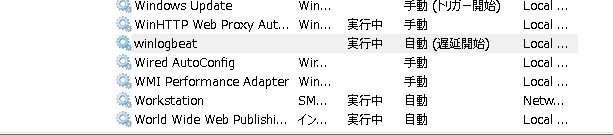
Start-Service winlogbeatサービスに登録されて、起動されていることが確認できます。
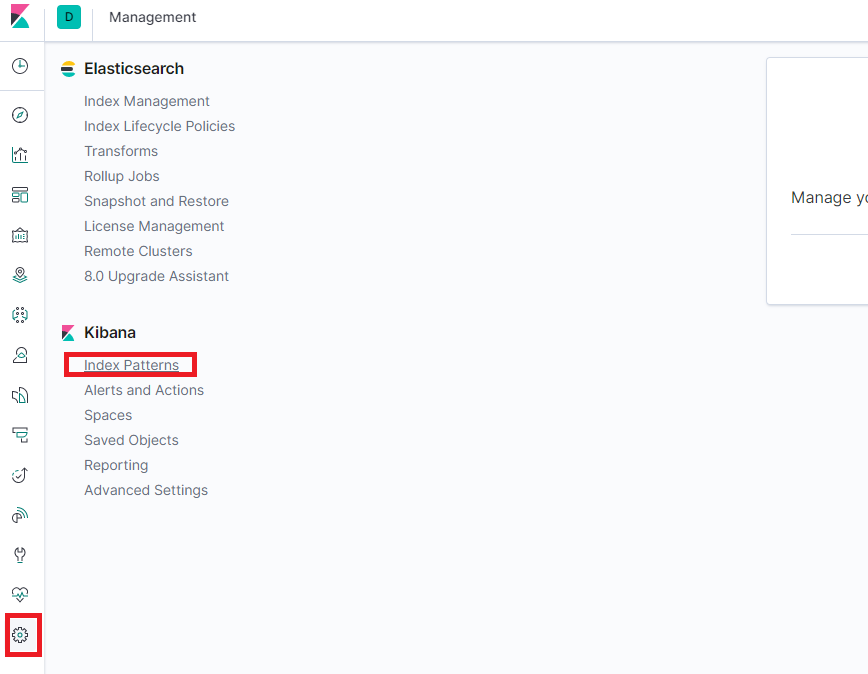
Kibana設定
kibana側でログを確認できるように設定します。
画面右下にある「歯車マーク」- > [Index patterns] を選択します。
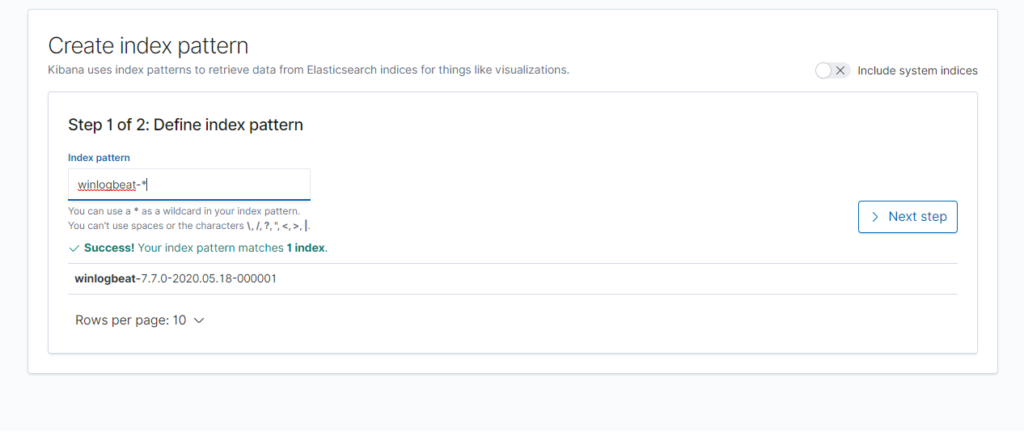
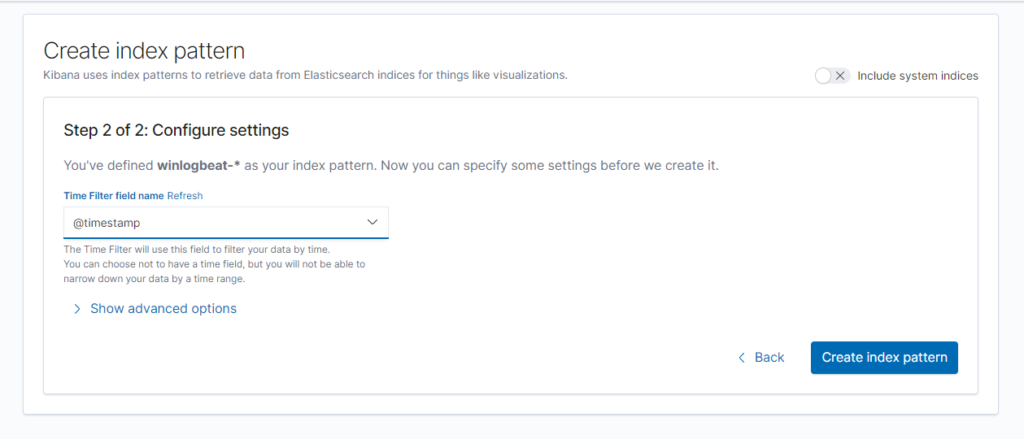
Index pattern : winlogbeat-*
と入力して「Next step」をクリックします。
次に
Time Filter field name : @timestamp
と入力して「Create Index pattern」 をクリックします。
ダッシュボードを確認するとlogが可視化されていることが確認できます。
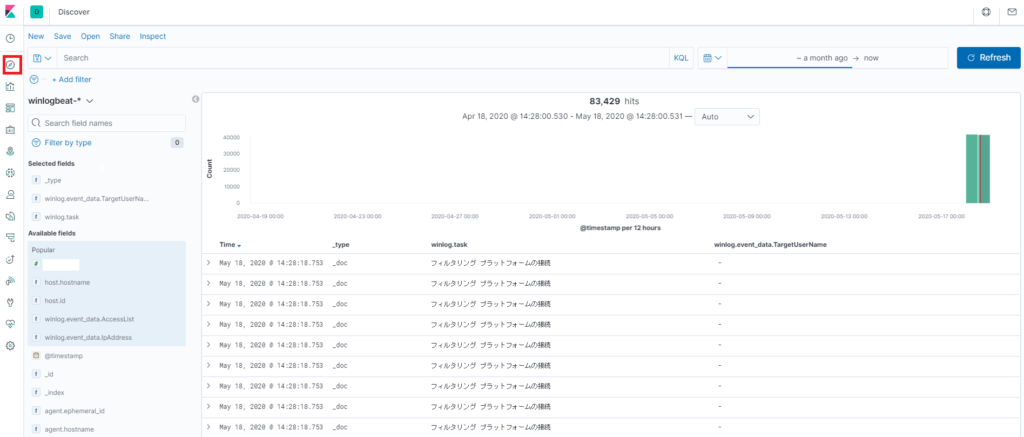
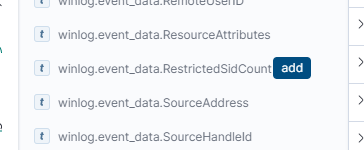
確認したい項目は「add」をクリックすれば追加されます。
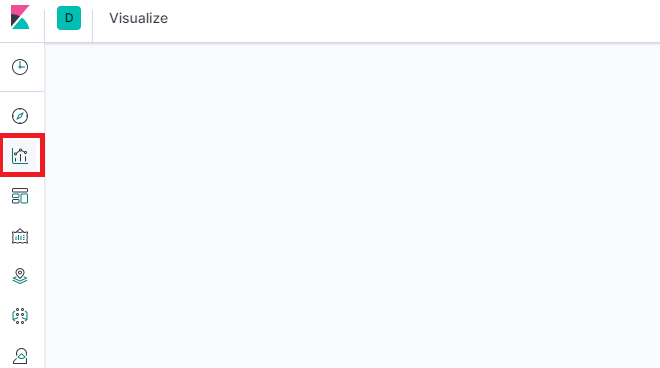
グラフ化する場合は、赤枠の「Visualize」をクリックします。
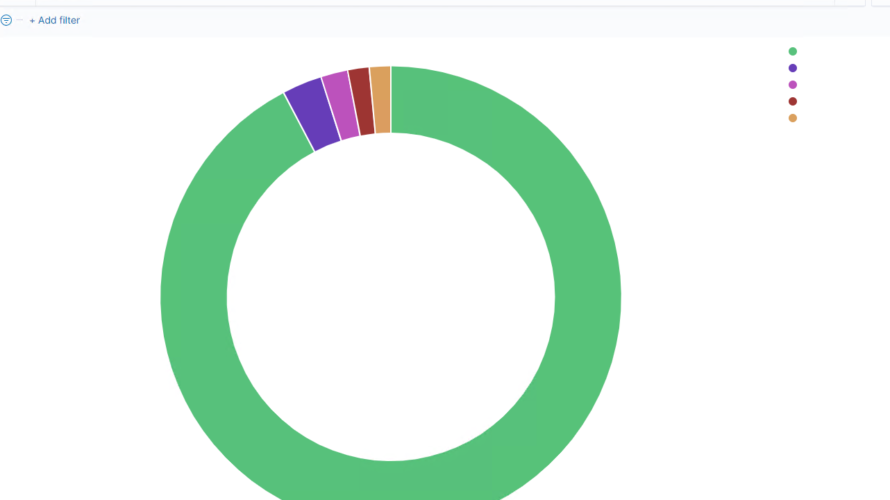
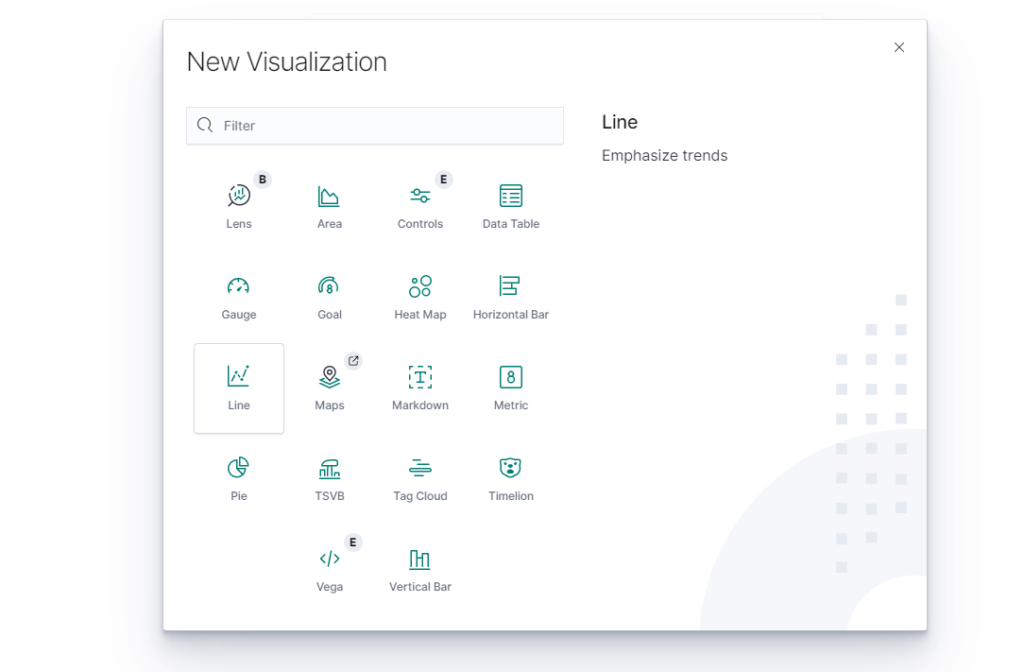
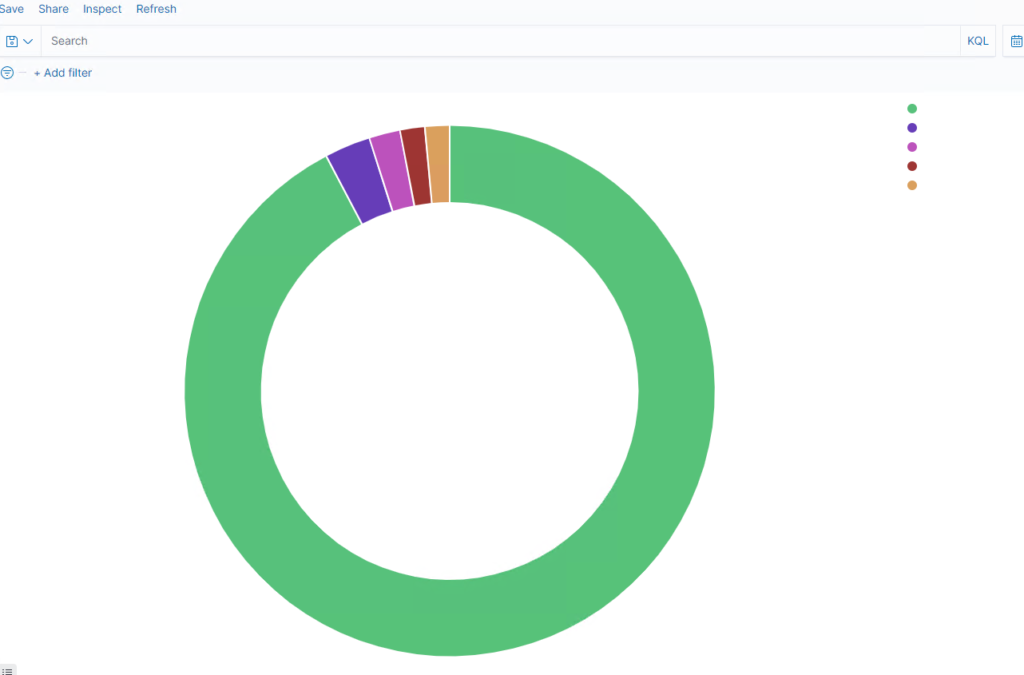
ここではログインユーザーを円グラフにしてみます。
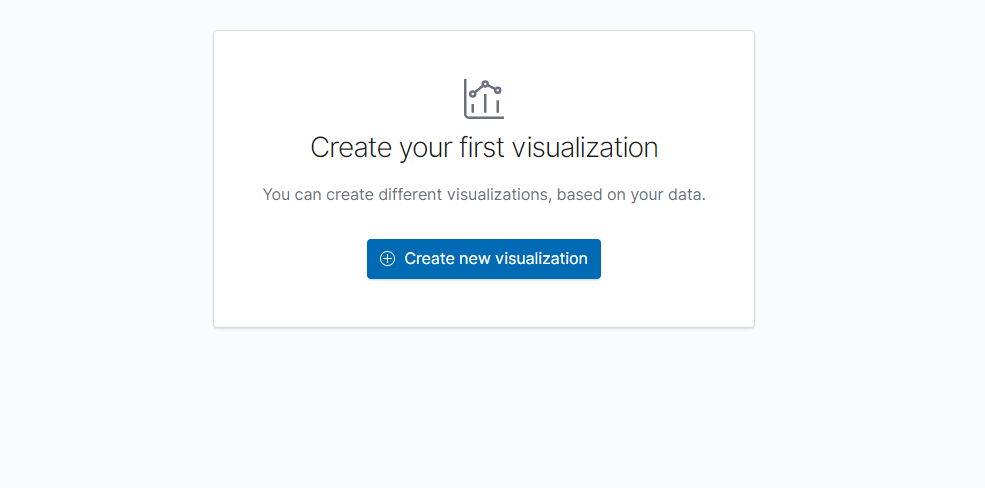
「Create new Visualize」をクリックします。
円グラフを作成するので「Pie」をクリックします。
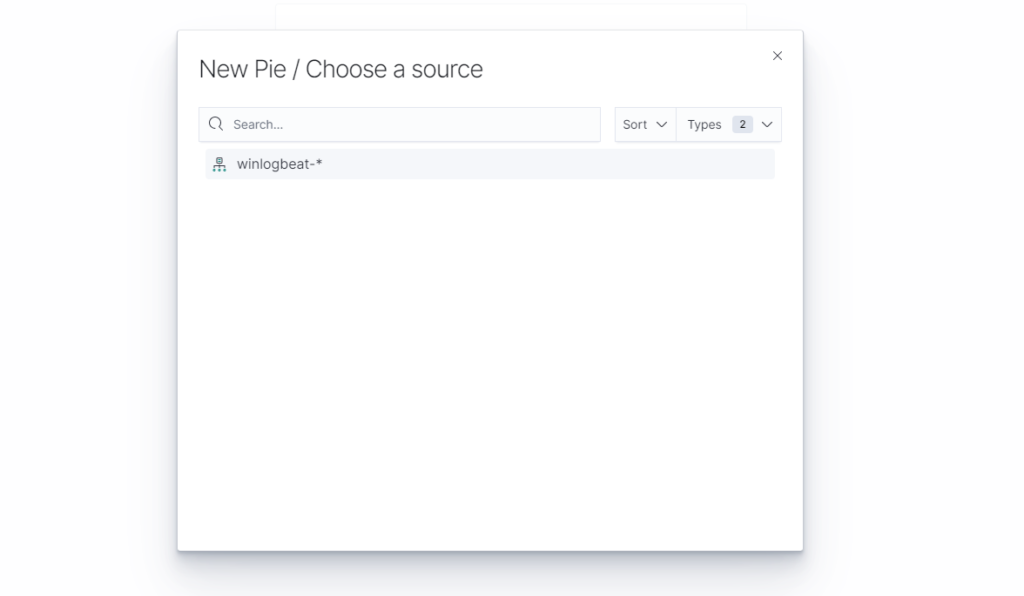
先程作成したソースを選択します。
Metrics -> Aggregation : Count
Buckets -> Aggregation : Terms
Buckets -> Field : winlog.event_data.TArgetUserName
Buckets -> Order by : Metric :count
を選択します。
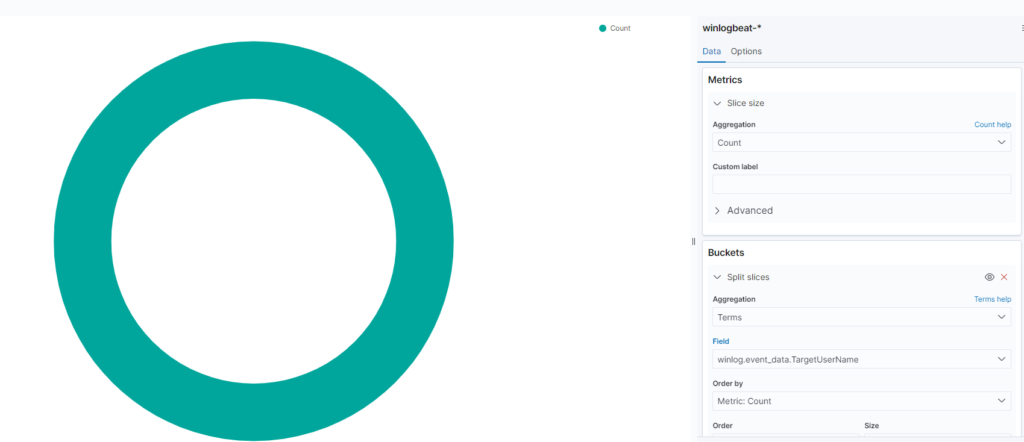
「Update」をクリックすると、ログインユーザーが円グラフとして表示されるようになります。
-
前の記事
docker-composeを使用してKanboardを構築する 2020.06.20
-
次の記事

apt install net-tools実行時に「Hash Sum mismatch」が発生した場合の対処法 2020.06.20