Python matplotlibを利用して3Dデータを可視化する
- 作成日 2020.01.17
- python
- matplotlib, python

matplotlibを利用して、簡単にデータを3D化してみます。
環境
- OS windows10 pron
- python 3.7.4
- pip 19.2.2
- conda 4.7.10
matplotlibインストール
matplotlibがインストールされていない場合は、インストールしておきます。
pip install matplotlibサンプルコード
適当な名前で下記のソースコードを記述します。
import matplotlib.pyplot as plt
from mpl_toolkits.mplot3d import Axes3D
fig = plt.figure()
ax = fig.add_subplot(111, projection='3d')
## xyz座標
x = [1, 2, 3, 4, 5 ,6, 7]
y = [1, 2, 3, 4, 5 ,6, 7]
z = [1, 2, 3, 4, 5 ,6, 7]
## c='green' マーカー色
## marker='s'' マーカーの形
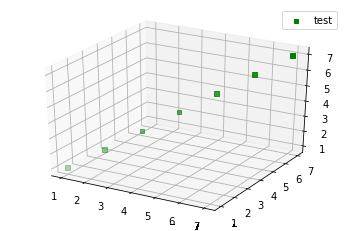
ax.scatter(x, y, z, c='green', marker='s', label='test')
ax.legend()
plt.show()実行します。今回はspyderを利用しているので、実行ボタンを押下して、実行してます。

実行すると、3Dデータが可視化されていることが確認できます。
-
前の記事

Nuxt.js 404エラーページを作成する 2020.01.16
-
次の記事

CentOs8 n packageを利用して最新版のnodejs環境を構築する 2020.01.17