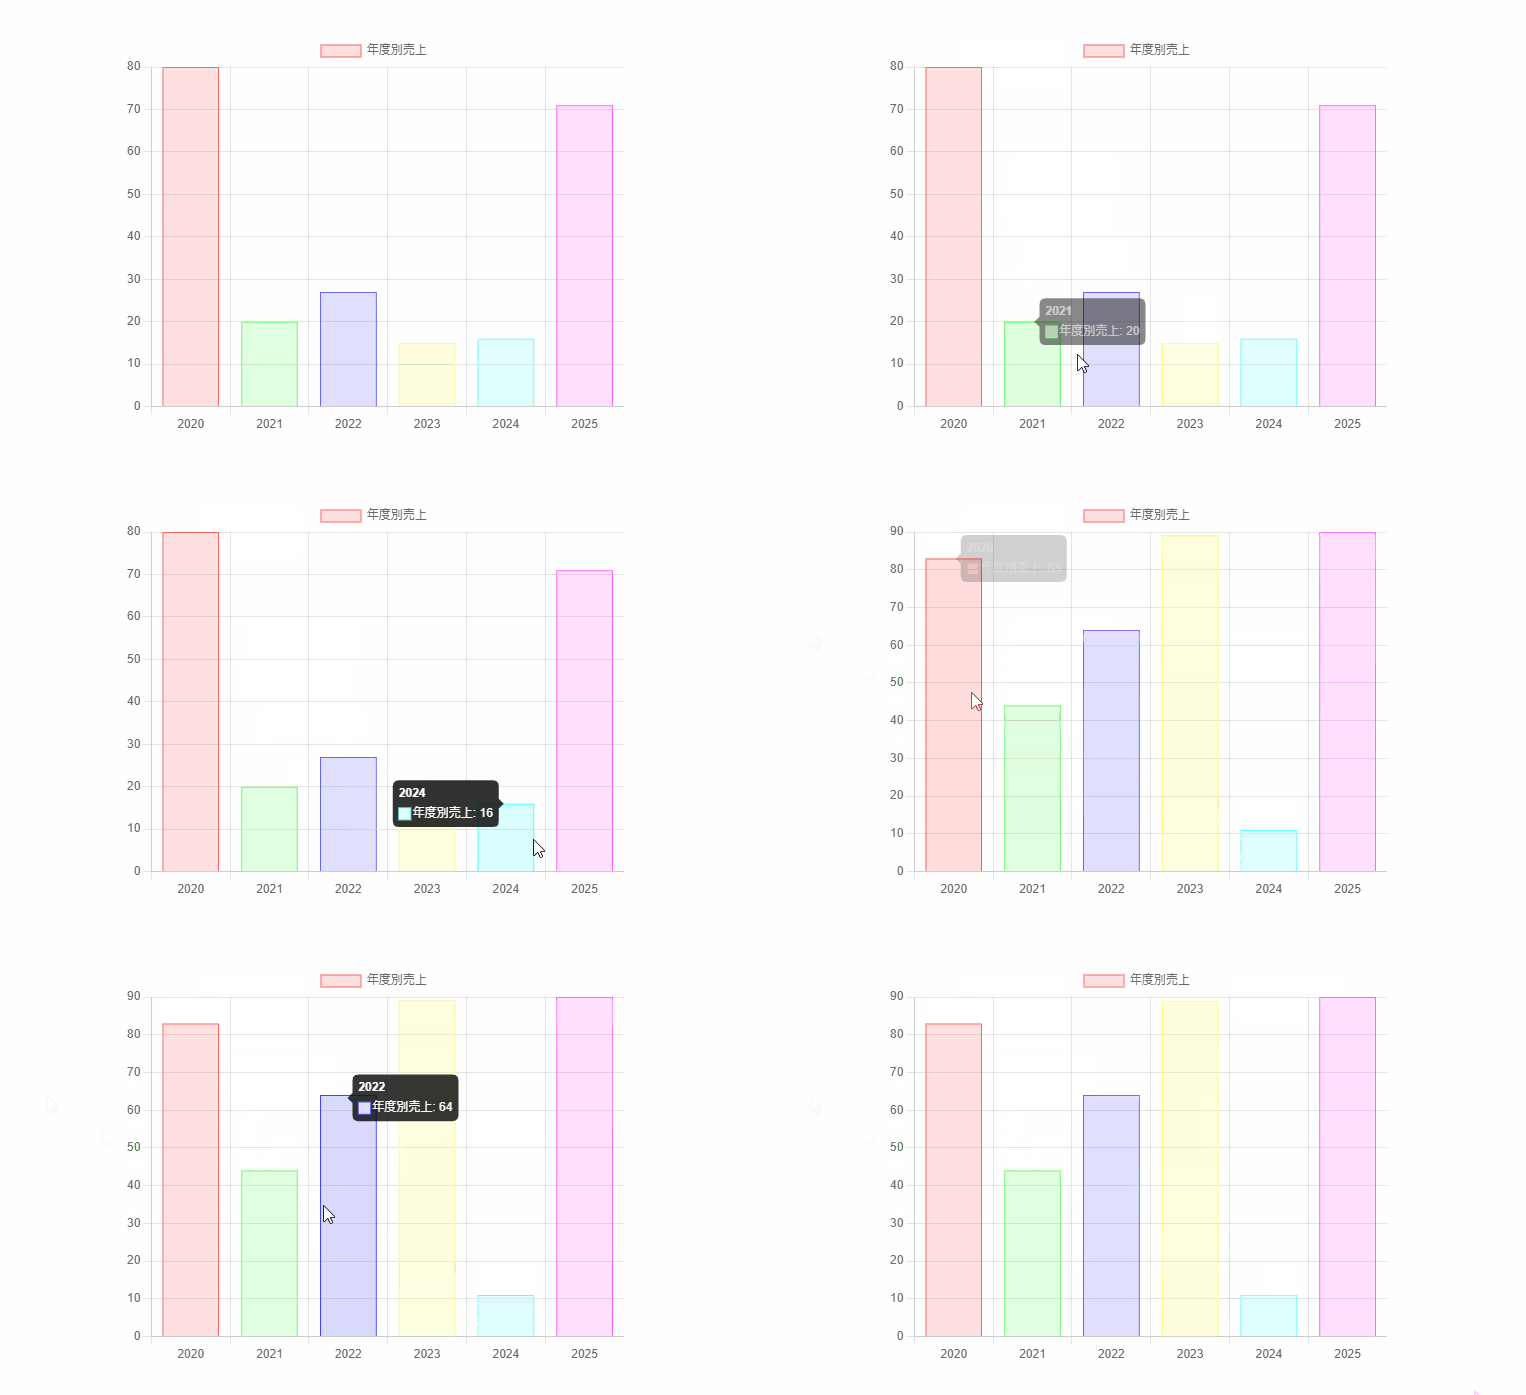
Chart.js 棒グラフを作成する

Chart.jsを使って棒グラフを作成するサンプルコードを掲載してます。ブラウザはchromeを使用しています。
環境
- OS windows11 pro 64bit
- Chart.js 3.7.1
- ブラウザ chrome 100.0.4896.60
Chart.js
こちらのサイトから最新版を確認して、CDN版を使用してます。
<script src="https://cdnjs.cloudflare.com/ajax/libs/Chart.js/3.7.1/chart.min.js"></script>
棒グラフを作成
棒グラフを作成するには、「type」に「bar」を指定します。
※CSSで全体の高さと幅を調整してます。
<!DOCTYPE html>
<html lang="ja">

<head>
  <meta charset="utf-8">
  <title>mebeeサンプル</title>
  <meta name="viewport" content="width=device-width, initial-scale=1.0">
  <script src="https://cdnjs.cloudflare.com/ajax/libs/Chart.js/3.7.1/chart.min.js"></script>
</head>

<style>
  #wrap {
    width: 500px;
    height: 500px;
    margin: 0 auto;
    margin-top: 100px;
  }
</style>

<body id="wrap">

  <canvas id="myChart"></canvas>

  <script>

    const ctx = document.getElementById("myChart").getContext('2d');

    let labels = []; // グラフのラベル
    let data = []; // データ用 ランダムに生成

    for (let i = 0; i < 6; i++) {
      labels.push(2020 + i); // ラベル生成
      data.push(Math.floor(Math.random() * 100)); // データ生成
    }

    // チャートオブジェクト
    const myChart = new Chart(ctx, {
      type: "bar",// グラフの種類
      data: {
        labels: labels,// ラベル
        datasets: [{
          label: "年度別売上",// タイトル
          data: data,// データ
          backgroundColor: [
            "rgba(255, 100, 100, 0.2)",// 背景の色
            "rgba(100, 255, 100, 0.2)",
            "rgba(100, 100, 255, 0.2)",
            "rgba(255, 255, 100, 0.2)",
            "rgba(100, 255, 255, 0.2)",
            "rgba(255, 100, 255, 0.2)"
          ],
          borderColor: [
            "rgba(255, 100, 100, 1)",// 枠線の色
            "rgba(100, 255, 100, 1)",
            "rgba(100, 100, 255, 1)",
            "rgba(255, 255, 100, 1)",
            "rgba(100, 255, 255, 1)",
            "rgba(255, 100, 255, 1)"
          ],
          borderWidth: 1// 枠線の太さ
        }]
      },
      options: {
        responsive: true,
        maintainAspectRatio: false,
        scales: {
          y: {
            beginAtZero: true
          }
        }
      }
    });
  </script>
</body>

</html>
実行結果をみると、ランダム生成したデータにより、棒グラフが作成されていることが確認できます。

-
前の記事

python バージョンを確認する 2022.05.05
-
次の記事

Linux 直前に実行したコマンドを実行する 2022.05.06


コメントを書く