Alpine.jsを使って棒グラフを作成する
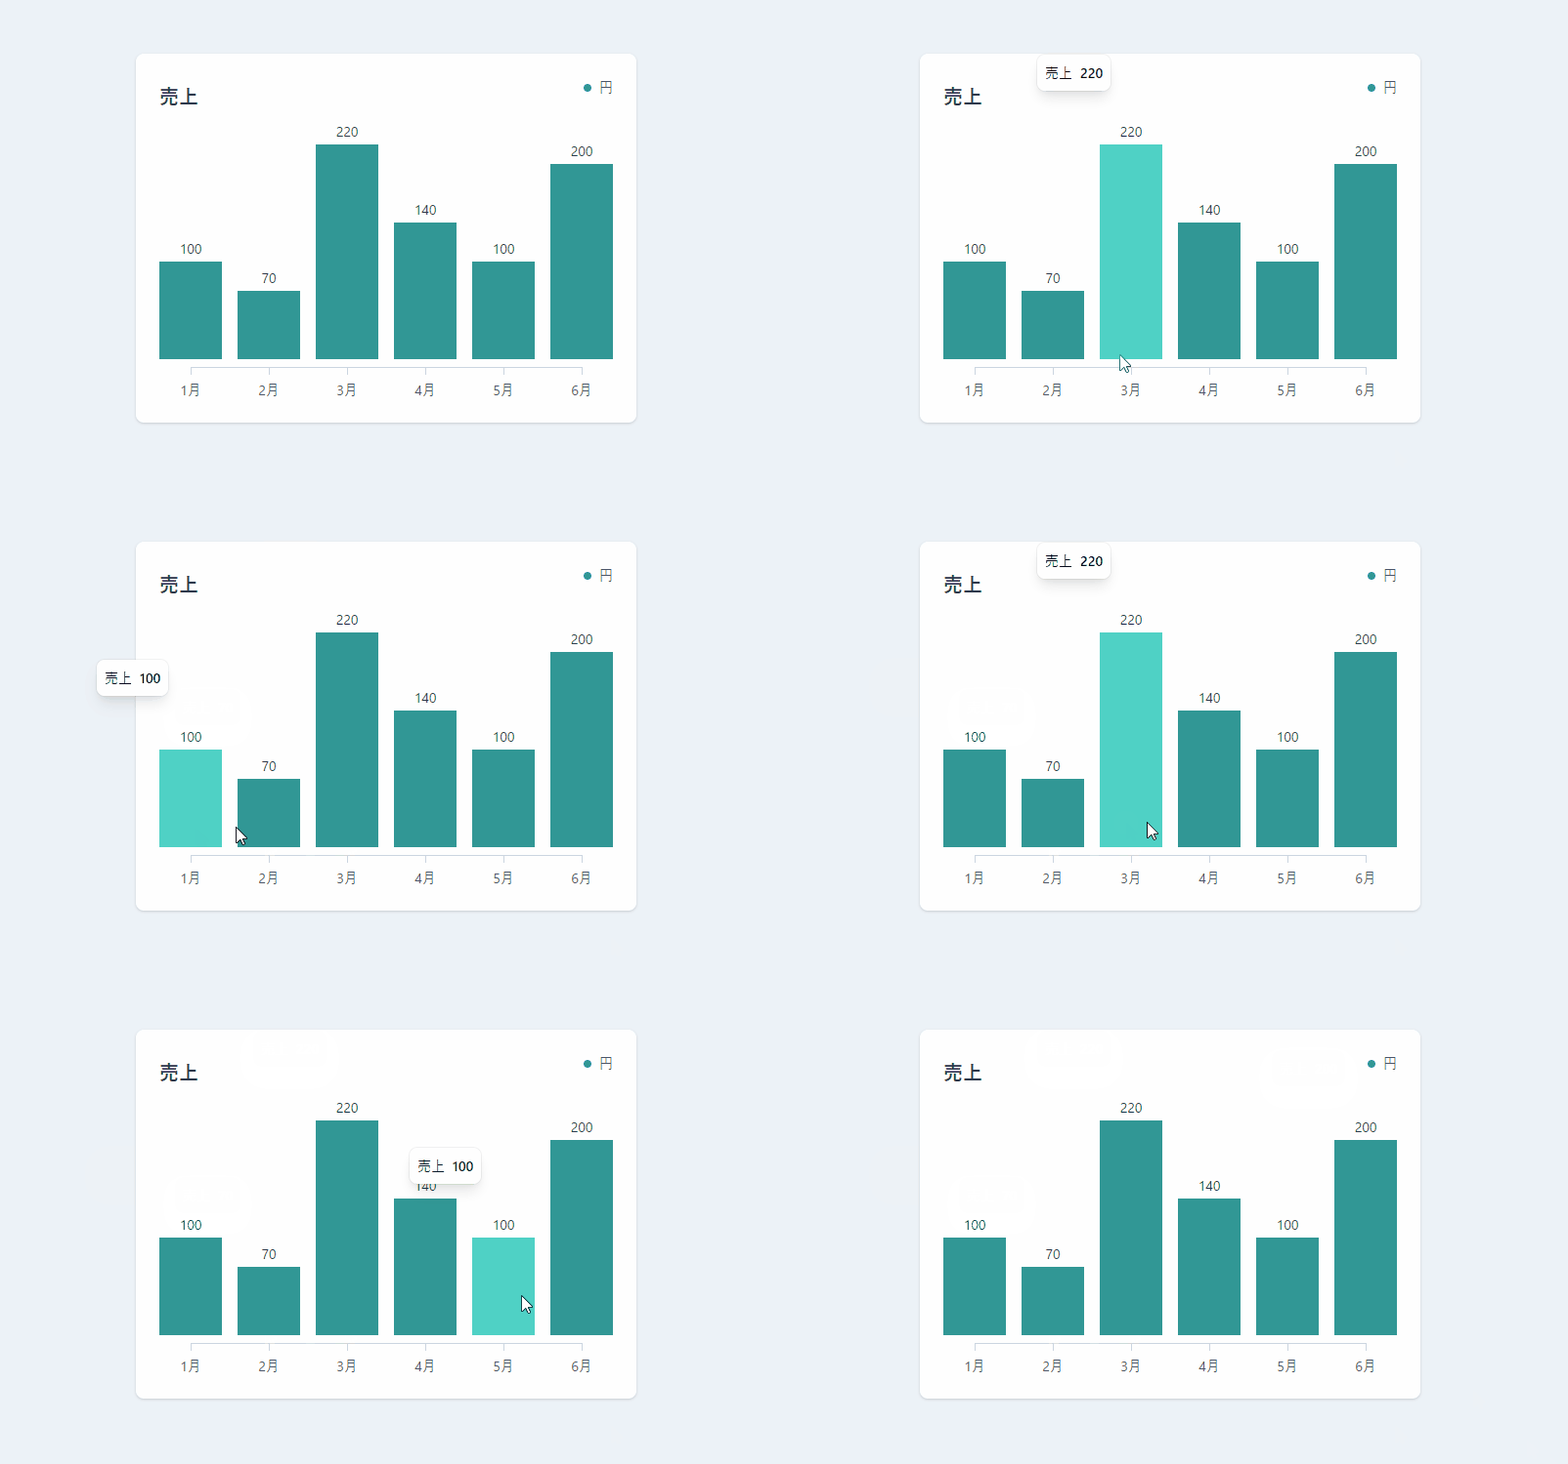
JavaScriptフレームワークの1つであるAlpine.jsを導入して、棒グラフを作成するサンプルコードを記述してます。
環境
- OS windows10 pro 64bit
- Apache 2.4.43
- ブラウザ chrome 84.0.4147.105
- Alpine.js 2.7.3
Alpine.js導入
CDNから読み込んで利用します。
<script src="https://cdn.jsdelivr.net/gh/alpinejs/alpine@v2.7.3/dist/alpine.js" defer></script>棒グラフを作成
「x-on・x-cloak・x-if・x-ref・x-html・x-for・x-show・x-text」ディレクティブを使用して、棒グラフを作成してます。
CSSにtailwindを使用してます。
<!DOCTYPE html>
<html lang="ja">

<head>
    <meta charset="utf-8">
    <title>mebeeサンプル</title>
    <link href="https://unpkg.com/tailwindcss@^1.0/dist/tailwind.min.css" rel="stylesheet">
    <script src="https://cdn.jsdelivr.net/gh/alpinejs/alpine@v2.7.3/dist/alpine.js" defer></script>
</head>

<body class="antialiased sans-serif bg-gray-200">
    <div x-data="app()" x-cloak class="px-4">
        <div class="max-w-lg mx-auto py-24">
            <div class="shadow p-6 rounded-lg bg-white">
                <div class="md:flex md:justify-between md:items-center">
                    <div>
                        <h2 class="text-xl text-gray-800 font-bold leading-tight">売上</h2>
                    </div>

                    <div class="mb-4">
                        <div class="flex items-center">
                            <div class="w-2 h-2 bg-teal-600 mr-2 rounded-full"></div>
                            <div class="text-sm text-gray-700">円</div>
                        </div>
                    </div>
                </div>

                <div class="line my-8 relative">

                    <template x-if="tooltipOpen == true">
                        <div x-ref="tooltipContainer" class="p-0 m-0 z-10 shadow-lg rounded-lg absolute h-auto block"
                            :style="`bottom: ${tooltipY}px; left: ${tooltipX}px`">
                            <div class="shadow-xs rounded-lg bg-white p-2">
                                <div class="flex items-center justify-between text-sm">
                                    <div>売上</div>
                                    <div class="font-bold ml-2">
                                        <span x-html="tooltipContent"></span>
                                    </div>
                                </div>
                            </div>
                        </div>
                    </template>


                    <div class="flex -mx-2 items-end mb-2">
                        <template x-for="data in chartData">

                            <div class="px-2 w-1/6">
                                <div :style="`height: ${data}px`"
                                    class="transition ease-in duration-200 bg-teal-600 hover:bg-teal-400 relative"
                                    @mouseenter="showTooltip($event); tooltipOpen = true"
                                    @mouseleave="hideTooltip($event)">
                                    <div x-text="data"
                                        class="text-center absolute top-0 left-0 right-0 -mt-6 text-gray-800 text-sm">
                                    </div>
                                </div>
                            </div>

                        </template>
                    </div>


                    <div class="border-t border-gray-400 mx-auto"
                        :style="`height: 1px; width: ${ 100 - 1/chartData.length*100 + 3}%`"></div>
                    <div class="flex -mx-2 items-end">
                        <template x-for="data in labels">
                            <div class="px-2 w-1/6">
                                <div class="bg-red-600 relative">
                                    <div class="text-center absolute top-0 left-0 right-0 h-2 -mt-px bg-gray-400 mx-auto"
                                        style="width: 1px"></div>
                                    <div x-text="data"
                                        class="text-center absolute top-0 left-0 right-0 mt-3 text-gray-700 text-sm">
                                    </div>
                                </div>
                            </div>
                        </template>
                    </div>

                </div>
            </div>
        </div>
    </div>

    <script>
        function app() {
            return {
                chartData: [100, 70, 220, 140, 100, 200],
                labels: ['1月', '2月', '3月', '4月', '5月', '6月'],
                tooltipContent: '',
                tooltipOpen: false,
                tooltipX: 0,
                tooltipY: 0,
                showTooltip(e) {
                    console.log(e);
                    this.tooltipContent = e.target.textContent
                    this.tooltipX = e.target.offsetLeft - e.target.clientWidth;
                    this.tooltipY = e.target.clientHeight + e.target.clientWidth;
                },
                hideTooltip(e) {
                    this.tooltipContent = '';
                    this.tooltipOpen = false;
                    this.tooltipX = 0;
                    this.tooltipY = 0;
                }
            }
        }
    </script>
</body>>


</html>
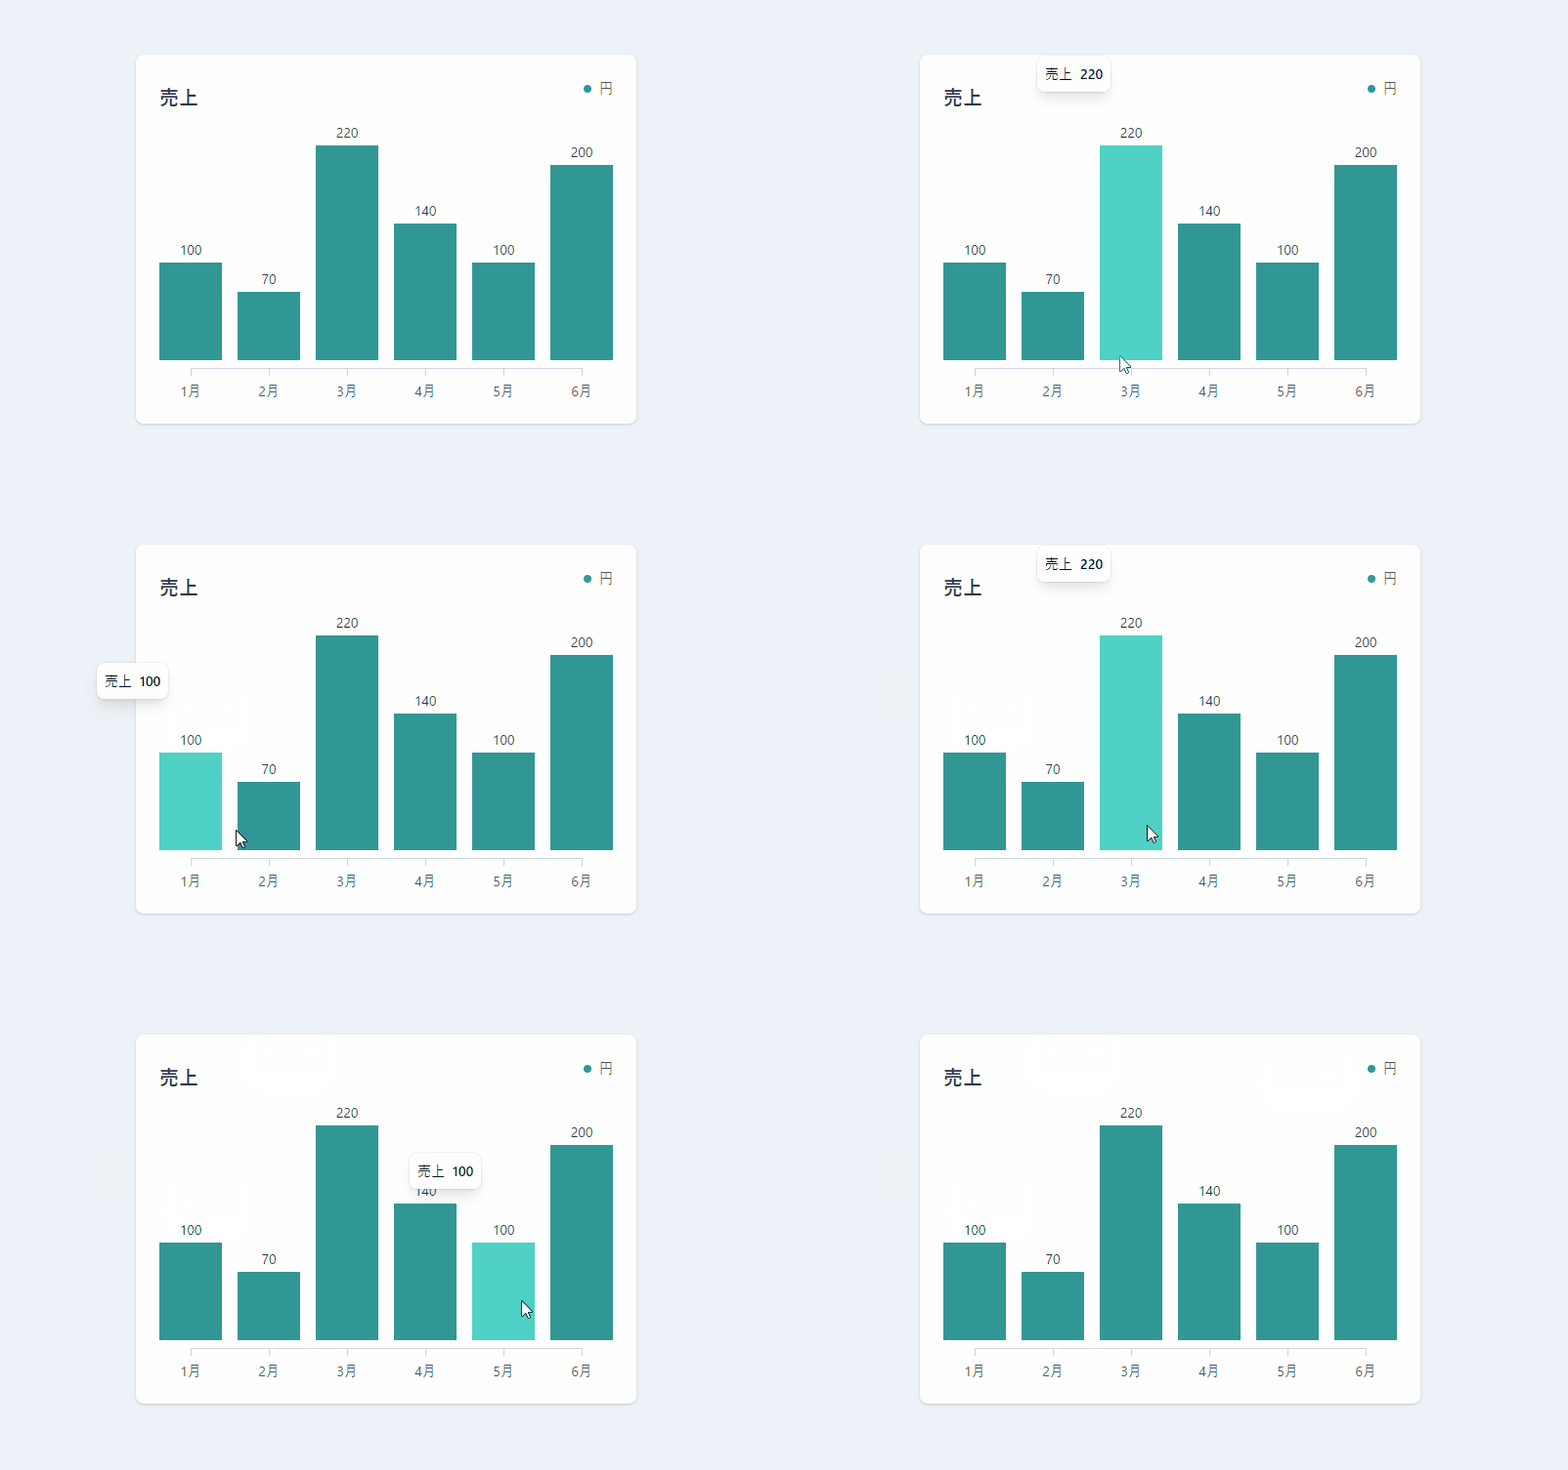
実行結果を確認すると「棒グラフ」が作成されていることが確認できます。
-
前の記事

javascript オブジェクトのプロパティの編集や追加をできないようにする 2021.01.21
-
次の記事
React.js ライブラリ「react-modern-drawer」を使ってナビゲーション・ドロワーを使用する 2021.01.21




コメントを書く